My wikifolio ("Somewhat better than DUCKS", ISIN: DE000LS9HDK3) is investable from 28.10.2016. It surely beats the DAX (main German stock index) both on absolute and risk-adjusted performance. Though I am very proud of my performance, I provide a closer look at it and show that sometimes I had just luck and sometimes I could have done better. I always preach for the rigorous and cold-blooded performance analysis and the best sermon is to demonstrate it by the example of myself.
As a friend of mine told me about wikifolio (in particular, an opportunity to get an ISIN for my fund for free) I got started with it after I finished my book "Knowledge rather than hope". However, I was pretty exhausted with writing a book, so I just bought some stocks from DAX and held them rather than trading actively.
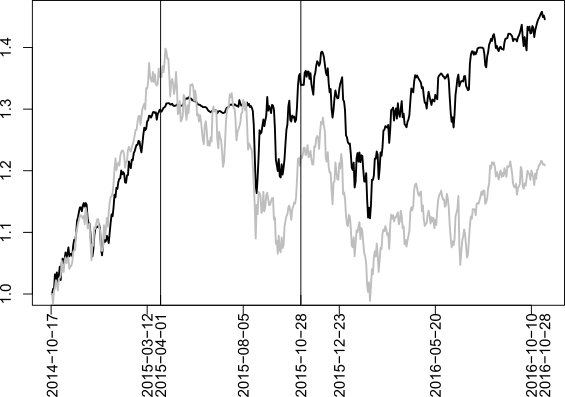
As Figure 1 shows, I had a very good luck with starting point, since the DAX (after a significant correction in Q3 2014) grew like a crazy. So I was much better than many of those, who actively managed their portfolios. In this sense: when a financial adviser shows you a performance chart of a fund, check whether there is a particular performance in the beginning. If yes, it may be a deceptive choice of the starting point. I myself, frankly admit that if I didn't have this luck, I would likely never published this wikifolio (I did it on the 1st of April 2015, in no way meaning to hoax :)). After publishing I soon went to cash since I anticipated a correction. There was no rationale behind it, it was just my gut feeling, based on my 10 years trading experience. And it didn't let me down: a thunderstorm come from China and the markets fell down. Now the title of my fund was justified and I decided to make it investable.
 |
 |
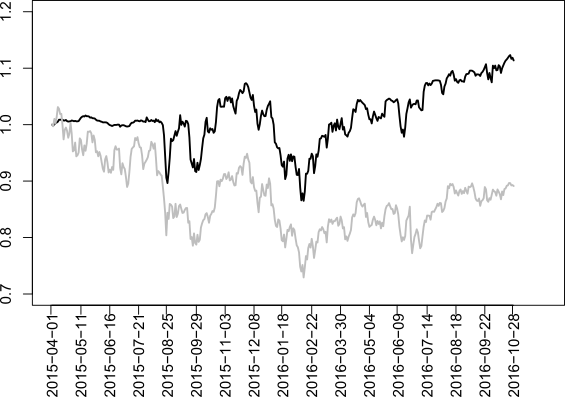
| Figure 2: My fund vs. DAX after publishing (left) & after issuing (right) | |
As Figure 2 shows, for a couple of months after making my fund investable I just followed the DAX. Next storm (which I this time failed to anticipate) came in January of 2016. Here I missed my luck: I was on a short ski vacation, my portfolio was mostly in cash and initially I wanted to have a full rest (from Internet and trading as well). But finally I decided to take my tablet and thus bought the stocks prematurely. Anyway, I resumed to outperform the DAX in February 2016. It was relatively easy in a turbulent market: first of all I jumped out before it reached the bottom and, to put it simply, I just bought as the stocks fell and sold them as they grew.
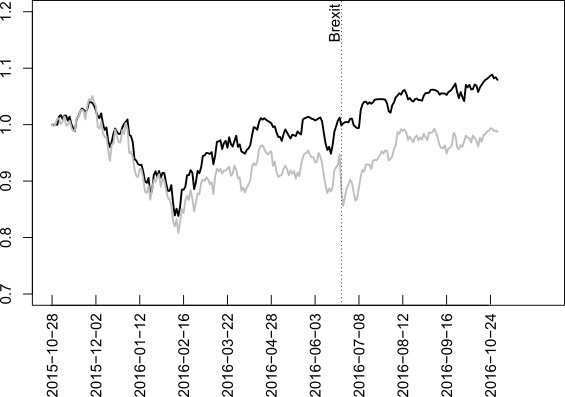
The next stage was Brexit, in which virtually nobody (including myself) believed. But trading is not about believes, it is about feeling the marked and even more it is about money management. So on 23.06.2016 23:07 I wrote:
| 75.7% in cash, 2.2% in ETC (Kupfer long, Öl Short) und nur 22% in Stocks. Klar setzt der Markt auf **Bremain** und so wird wahrscheinlich sein. Dann kann DAX noch 3%-4% hochklettern (dabei werden wir immernoch somewhat better than DUCKS bleiben). Aber wenn doch Brexit, gehen die Märkte in freien Fall etwa wie im 2011 beim USA Downgrade. Weil wir nicht zocken, sondern systematisch handeln, bleiben wir überwiegend in Cash und nach dem BRErgebnis schauen wir!
75.7% in cash, 2.2% in ETC (copper long, Oil short) and only 22% in stocks. Obviously, the market bets on **Bremain** and likely it will be the case. But then the DAX might grow 3% or 4% (and in this case I will still remain better than it). But if BrExit does happen, the market will fall like in 2011 after the USA rating downgrade. Since we don't gamble but rather systematically trade, we remain mostly in cash until the BREsult. |
In a sense the Brexit was a luck for me, however, it was fully deserved. Interestingly that though the market did fall, contrary to my expectations, it was not similar to 2011: not only has the market very quickly recovered but it also marked the new highs.
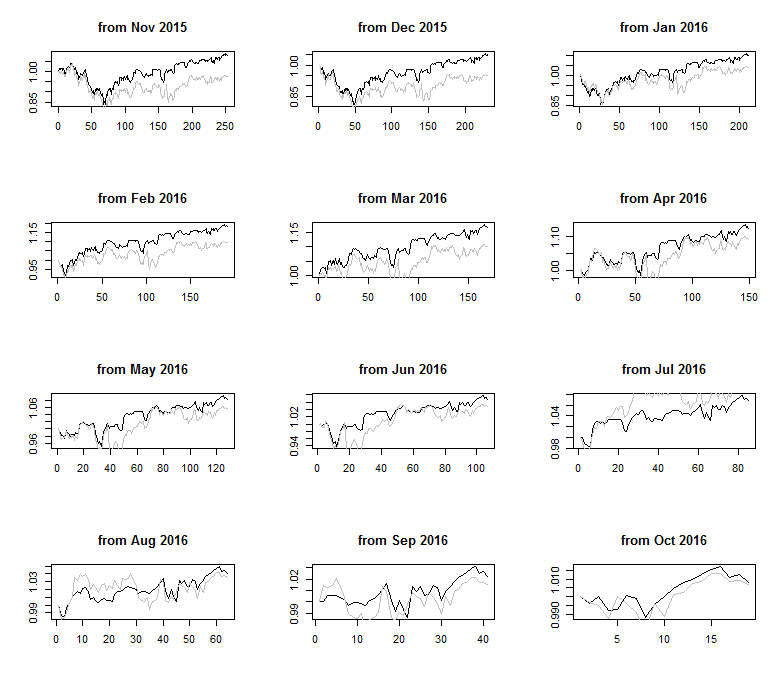
Figure 3 shows that each month I have beaten the DAX with an exception of the quick recovery after the Brexit in July 2016. Figure 3 is very important in the sense of a Sparplan (a saving plan), which is very popular in Germany. The idea is as follows: each time (usually after the wage comes to the bank account) an investor puts a certain amount of money in the fund(s) of his choice. Figure 3 shows that my fund is better than DAX also in terms of a Sparplan.
Finally, let us analyze the consistency of my returns just like I did it for Einstein the Superstar. First of all let us look at the returns on trades per se.
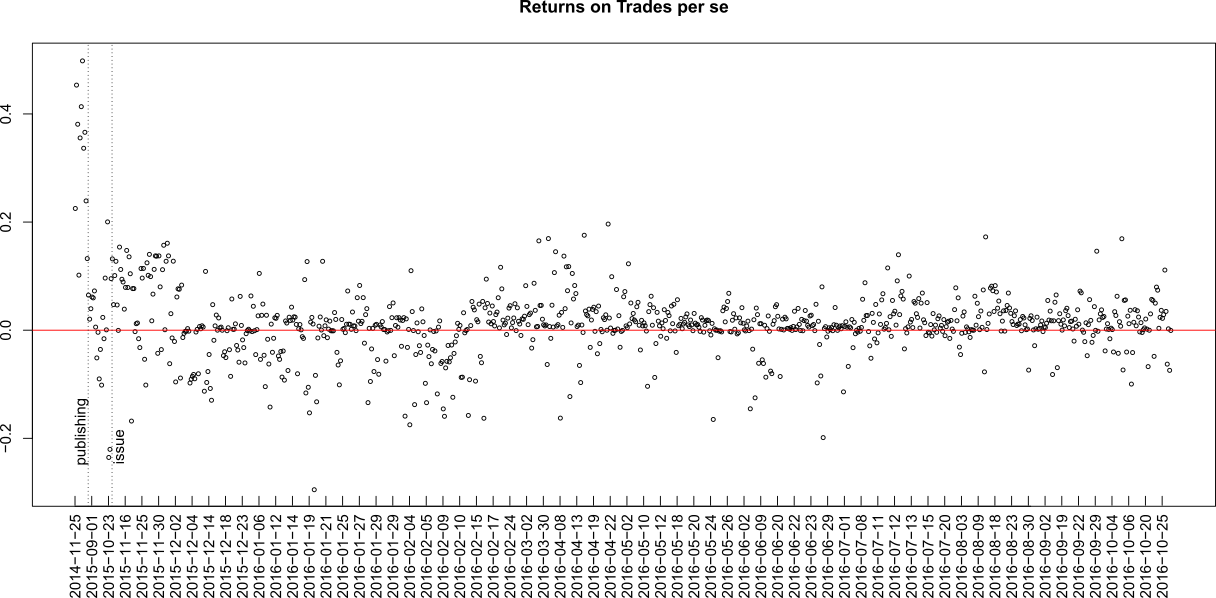
They are pretty homogeneous (and thus consistent!), however, a good eye might be caught with the fact that after the publishing and issuing I changed a trading approach: now there are more trades with a smaller absolute value of returns. Note that the scale of the axis X is not proportional: the timespan between two adjacent SELL-transactions is not constant, whereas the axis graduation is equidistant.
And of course it does make sense to have a look at the returns on trade in portfolio context.
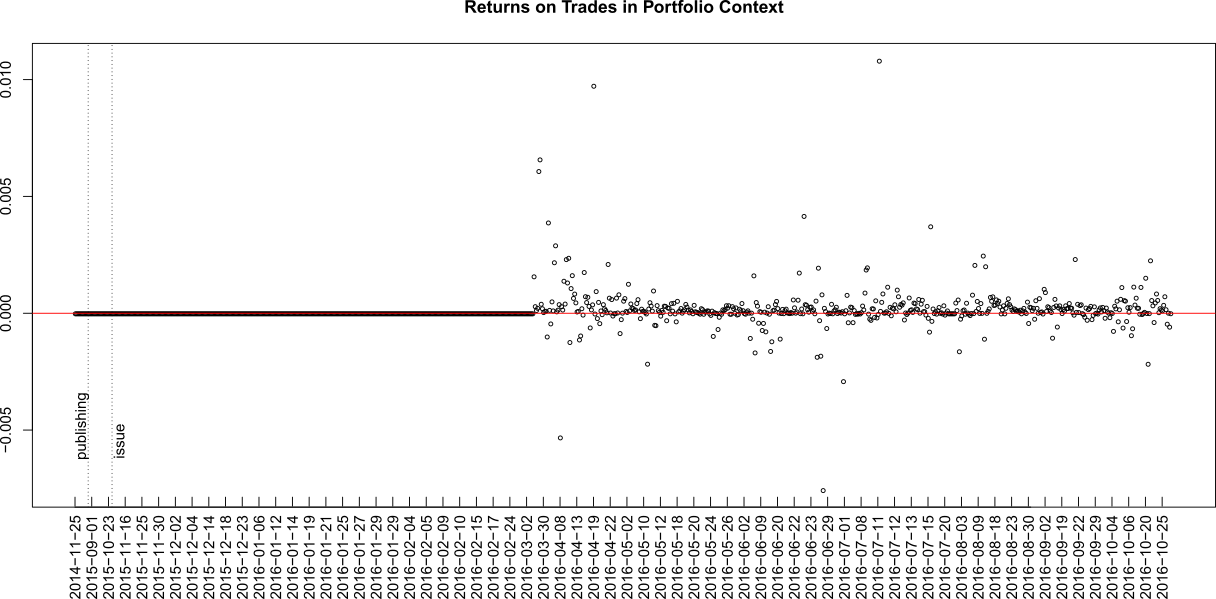
Unfortunately, (for whatever reason) Wikofolio does not provide the trade weights statistics prior the end of Febrary 2016 (one can still approximately calculate them from trade history and historical portfolio hourly prices but it would mean too much overheads). Anyway, you see that the weighted return are also more or less stationary and pretty small in absolute value. This is actually good, since commiting a lot of small trades with a positive edge is an only way to grow the money steadily whereas keeping the drawdown small.
But do I have an edge? Oh, yes! As I analyzed Einstein's performance, I emphasized that he had 503 of 883 profitable trades. My ratio is even better (namely, 658 of 918) but in my case it is not an argument since I often partially take small profits when I feel that a position is overweighted. I am frankly telling you about this but how to check it in general case? Easily: just calculate the average values of all positive and negative returns (in my case they are, respectively, 3.88% and -4.95%). As to the unconditional mean return (on trade per se), it is equal to 
As to the total (unconditional) weighted mean return, it is 0.024% and the Student's t-test tells us that it is not an accident: the 99% confidence interval is between 0.012% and 0.036%, i.e. positive in either case. But 0.024% is a very small number, isn't it?! Well, if you commit a lot of suchlike trades, the cumulative gain will be impressive. Moreover, small returns also keep a possible drawdown small! Let us make a small Monte-Carlo simulation.
PROFIT_PROB = 415/(415+119)
N_TRADES = 918
N_SCENARIOS = 1000
PROFIT = 0.00045
LOSS = -0.0005
scenMatrix = array(0.0, dim=c(N_SCENARIOS, N_TRADES))
for(ss in 1:N_SCENARIOS)
{
  scenario = rbinom(N_TRADES, 1, PROFIT_PROB)
  scenario[which(scenario==0)] = LOSS
  scenario[which(scenario==1)] = PROFIT
  scenMatrix[ss, ] = cumprod(1+scenario)
}
ts.plot(t(scenMatrix), xlab="Number of Trades")
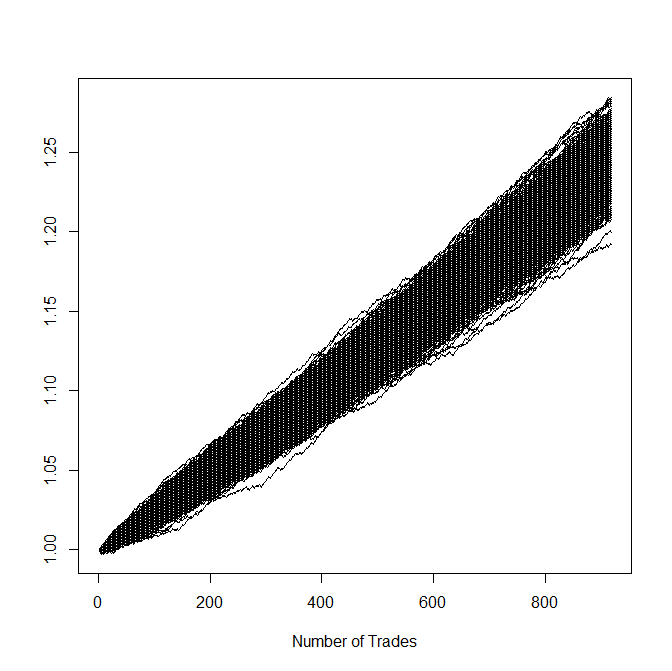
Figure 5 tells us that even in the worst case scenario our portfolio grew steadily and virtually without a drawdown!
Finally, let us have a look at the return statistics per asset.
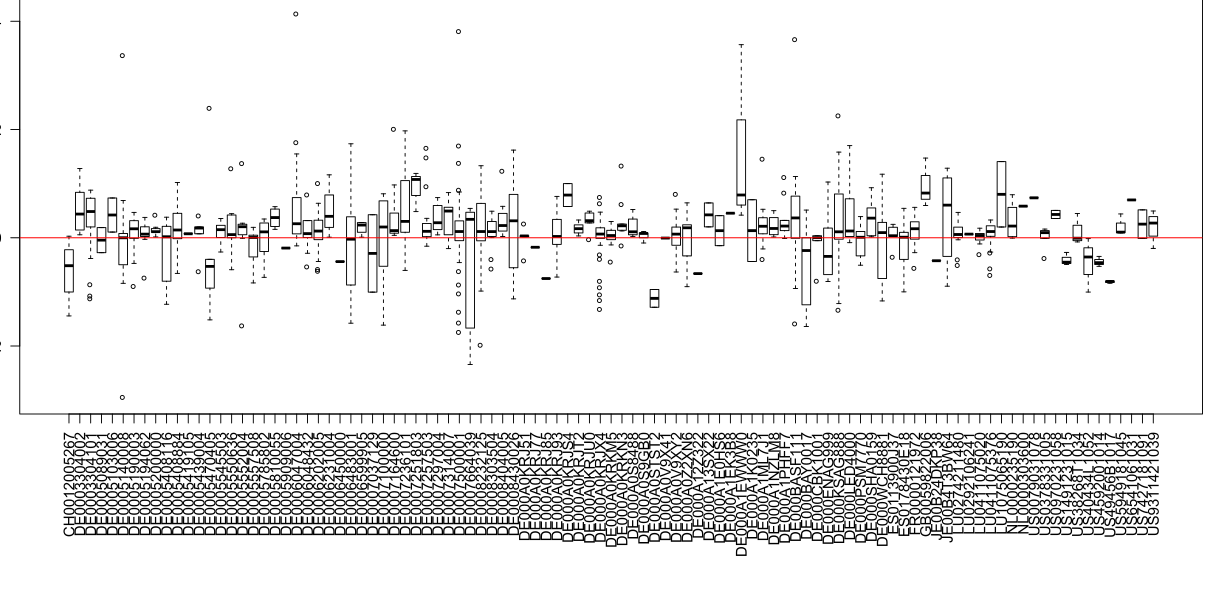
It is not as homogenious as by Einstein but still it indirectly confirms that (most of time) I cleverly choose the assets. I make no secret that I cannot do a thorough fundamental analysis of all stocks (I do it in my free time, which is pretty limited) so often I rely on purely quantitative indicators. Sometimes they let me down but usually they function well.
Supplement: R-code, source data and diagrams in higher resolution
FinViz - an advanced stock screener (both for technical and fundamental traders)