
Summary:
- Robo-advisors promise the risk profiling in a few easy steps, which is unrealistic both from mathematical and behavioral points of view.
- The "optimal" portfolios are usually based on Markowitz-like models, which are inapplicable in practice due to their extreme numerical sensitivity to the market parameters estimation errors.
- Robo-advisors lure investors with low management fees but minimizing fees and maximizing the wealth is not the same. Moreover, the compound costs are not so small in the long term.
- A positive side: Robo-advisers do not (yet) foist toxic financial products upon you.
FinTech currently booms and the robo-advisors are not an exception. Their ideology is based on the so-called efficient market theory. To put it briefly, they affirm that nobody can beat the market, so an investor should invest passively (i.e. buy-and-hold), diversify his portfolio and save on management fees.
Since many fund managers fail (esp. in current turbulent markets), the efficient market hypothesis doesn't look implausible. However, what about Warren Buffet and humble myself with systematic market outperformance?! "I'd be a bum on the street with a tin cup if the markets were always efficient", says the magnificent Warren. By the way, his magnificence is not [only] in making 20% annual return on average but, first of all, in making it on a huge capital, which he has under management. And it is possible to make much bigger return on a small capital, for instance, this smart guy made 1800% in three years. The pitfall here is that he trades mostly small caps, so for a million dollar investment there would be insufficient market liquidity. But most of private investors have much less to invest, so the (un)scalability is not a problem for them. A correct interpretation of the efficient market theory should thus be as follows: the market is usually efficient (i.e. random, chaotic, unpredictable) but sometimes it gives you very good chances. Due to limited market liquidity not all of them can be exploited by big institutional investors but you as a private trader can exploit most of them (and letYourMoneyGrow.com is to help you to do it).
As to the diversification and the "optimal" asset allocation, in order to understand their limitations in detail you need some math knowledge (which we will cover in our numeracy lessons). But to put it briefly, the assets are nowadays strongly correlated (i.e. they tend to move in the same direction). Have a look at principle component chart of DAX stocks.
In DAX there are 30 stocks but their movements are not independent. And by means of the principle component analysis (PCA) we can see that the whole index is driven by not more than 5 significant factors, two of which dominate by far. This is actually plausible, since current markets are mostly driven by central bank policies and governmental macroeconomic decisions rather than by performance of the companies (which, however, does not mean that you should neglect fundamental firms' data).
Moreover, even if the assets correlations are low, it may happen (and actually happens) that the assets grow more or less independently. But as soon as panic breaks out and everybody sells-sells-sells everything falls together (thus a diversification reaches its limits). Have a look at the scatter plot of Daimler's and Deutsche Bank's daily returns. Their correlation is 0.68, which is though strong but still would be acceptable. However, there is much more dependence as they fall than as they grow, so the diversification effect is insufficient.
But please understand the message correctly: I am not telling you that the diversification is useless, I merely emphasize that its positive effect should not be overestimated (for more details please read this case study).
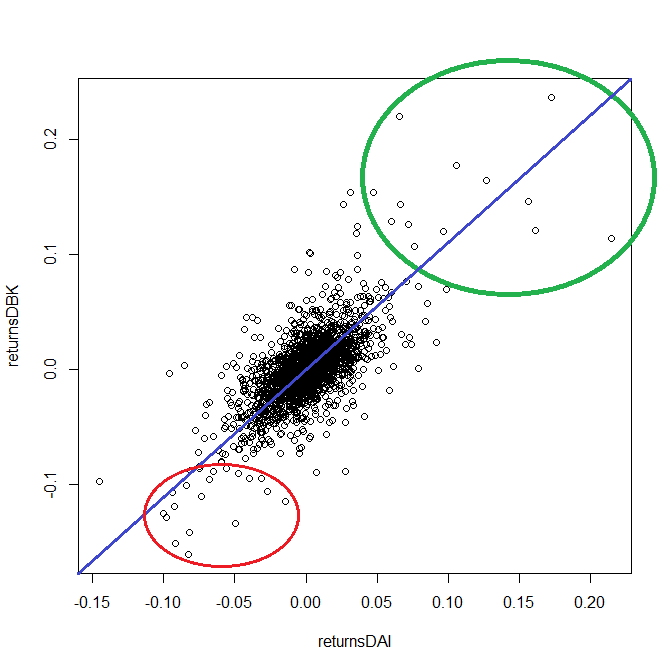
You can reproduce Figure 2 with the following R Code:
#get data from Yahoo.Finance on DeutscheBank and Adidas
isQM = require(quantmod)
if (isQM == FALSE)
{
    install.packages("quantmod")
    require(quantmod)
}
getSymbols("DAI.DE", from="2008-01-01", to="2016-09-16") #Daimler
getSymbols("DBK.DE", from="2008-01-01", to="2016-09-16") #Deutsche Bank

#calculate historical daily returns and their correlation
returnsDAI = as.numeric(ClCl(DAI.DE))
returnsADS = as.numeric(ClCl(DBK.DE))
print(cor(returnsDAI[which(!is.na(returnsDAI))], returnsDBK[which(!is.na(returnsDBK))]))
plot(returnsDAI,returnsDBK)
The next problem, which hardly can be solved straightforwardly is the optimal asset allocation, i.e. how to optimally spread your capital over different assets. The first, who theoretically solved this problem was Harry Markowitz. We will not dwell deeply in theory, we just say that in this model one needs to find an inverse of the estimated covariance matrix and the result is very sensitive to the estimation errors. The following R code imitates our challenge: first we simulate 1000 returns (i.e about 4 years of historical data). Then we try to estimate the genuine market parameters from this sample. We repeat this procedure 3 times and each time we get significantly different solutions!
#####set the "genuine" market parameters#######################
sigma1 = 0.4  #vola of the 1st asset
sigma2 = 0.3  #..of the 2nd asset
rho = 0.7     #correlation coefficient,  must be in [-1, 1]
mu1 = 0.12    #expected return of the 1st asset
mu2 = 0.09    #..of the 2nd asset
rfr = 0.01     #risk-free return
N_SIM = 1000 #number of simulations

######## theoretical solution with "genuine" market parameters ########
library("mvtnorm") #multivariate Normal distribution
library("MASS")    #[generalized] matrix inverse
covMatrix <- matrix(c(sigma1*sigma1, sigma1*sigma2*rho, sigma1*sigma2*rho, sigma2*sigma2), 2,2)
vectorOfMeanReturns = c(mu1, mu2)
H=chol(covMatrix)
print( "Optimal portfolio with TRUE market parameters" )
ginv(t(H)%*%(H)) %*% (vectorOfMeanReturns - rfr)


################################################################################
######## solution with market parameters, estimated from "historical" data #####
################################################################################
#### three trials.
###   NB! All trials have identical input data but pretty different output!  ###
for(trial in 1:3)
{
   historicalData = mvrnorm(n=N_SIM, vectorOfMeanReturns, covMatrix)
   empSigma1 = sd(historicalData[,1])
   empSigma2 = sd(historicalData[,2])
   empRho = cov(historicalData[,1], historicalData[,2]) / empSigma1 / empSigma2
   empiricalCovMatrix = matrix(c(empSigma1*empSigma1, empSigma1*empSigma2*empRho,
   empSigma1*empSigma2*empRho, empSigma2*empSigma2), 2,2)
   empricialVectorOfMeanReturns = c(mean(historicalData[,1]), mean(historicalData[,2]))
   H=chol(empiricalCovMatrix)
   print( paste("Optimal portfolio with EMPIRICAL market parameters - TRIAL ", trial) )
   print( ginv(t(H)%*%(H)) %*% (empricialVectorOfMeanReturns - rfr) )
}
There were attempts to overcome this instability problem and the most known alternative approach is the Black-Litterman model. However, it implies knowledge (or view) on future dynamics of some assets. I, myself, have proposed an alternative based on the Kelly criterion, whose numerical instability declines as investor's risk aversion grows. But it requires an exhaustive profiling of investor's preferences (which cannot be done in few clicks).
Last but not least, both investors' preferences and market parameters do change in time. Thus a one-time risk profiling and portfolio optimization make little sense, even if they were precise and numerically stable. But they are not (some robo-advisors may claim they have a proprietary method that does work but I will not believe them until they disclose the method ... and if they do I am sure I will find its incorrigible flaws).
Finally, what about costs? Let's have a look a the tempting chart by wealthfront.com (which is likely the most known robo-advisor). Annually they charge "merely" 0.25% and they they show how much would you save over 30 years against a traditional advisor that charges 1%. However, 0.25% over 30 years yields 7.8% ( 
As you can see the robo-advisors is probably the easiest but not necessarily the best way to invest. In the era of zero (or even negative) interest rates you have to invest in order to save (let alone to grow) your money. So I would recommend you to use robo-advisors, if you are lazy or very short of time. We are even going to make individual reviews of most popular robo-advisers to help our readers to choose the best (or, well, the least worse :)) one. At least they don't (yet) foist toxic financial products upon you and prevent you from making typical newbie's mistakes like investing all your money in a single stock.
But if you are willing to learn and have some time, we can offer you a better alternative! We will provide a powerful portfolio optimization toolbox to you. We cannot promise that it will do all job for you but it will still be very helpful. Our numeracy lessons will help you to use it correctly and efficiently. And of course we will frankly tell you about the limitations of our toolbox (remember, there is no silver bullet and even if there is one, noone will provide you with it for little money).
FinViz - an advanced stock screener (both for technical and fundamental traders)